

New here? Take a Tour
The fastest way to learn the Collaboration Map — in-context highlights walk you through each tool. You can restart any tour from here anytime.
User Guide & Methodology
Network Map Tool
Pan, zoom, and search the co-authorship graph. Click any researcher for their profile and publications.
Network Map Tool
Pan, zoom, and search the co-authorship graph. Click any researcher for their profile and publications.
Network Navigation
- Zoom:Use your mouse scroll wheel or the zoom buttons on the left toolbar.
- Pan:Click and drag the background to move around the network.
- Details:Click any researcher node to view their full profile and publication history.
Finding Information
- Search:Use the search box in the right sidebar to locate specific researchers by name.
- Legend:Check or uncheck categories in the network legend — TRSM Faculty, Affiliated, External, and collaboration types — to show or hide groups of nodes and collaborations.
- Year Range:Drag the year range handles in the sidebar to limit the network to co-authorships from a specific publication window.
Why some researchers sit in the center
Position in the network is shaped by co-authorship. Nodes with many collaborations — especially ones reaching across groups — are pulled toward the middle.
Why is this researcher in the center?
Researchers within Group A publish with each other, and researchers within Group B publish with each other, but the two groups don't publish together directly. One researcher co-authors with people in both groups, so each of those collaborations pulls them in a different direction, settling them in the middle. A researcher with just one visible collaboration is pulled in only one direction, so they stay near the rim.
Only visible collaborations count: filters, the year range, and the legend all change who is in the middle.
How to read node positions
With Group by department enabled, a researcher's department sets their colour and target cluster. But their visible collaborations still matter: publishing with colleagues outside that department can pull them away from it.
Why are some researchers in the network located farther from researchers in their department?
A researcher may appear farther from their departmental peers because no co-authorship collaborations with colleagues within their own department has been captured by the current data. Instead, they may have collaborations with researchers in other TRSM departments. These cross-departmental collaborations pull the researcher toward their co-authors and away from their department's main cluster.
Positions can change with the selected layout, filters, year range, and newly added publication data.
Analytics Tool
Four views of TRSM publication output, research hotspots, faculty rankings, and collaboration patterns.
Analytics Tool
Four views of TRSM publication output, research hotspots, faculty rankings, and collaboration patterns.
The Analytics tool organizes the active dataset year range into four views. Counts combine OpenAlex, Web of Science, manual curation, and faculty-submitted updates; each view shows when its data was last updated.
Overview
- Snapshot:TRSM faculty and publication counts, co-author collaborations, and median co-authors per faculty member.
- Top 10:Leading research contributors and co-authorship leaders; select a bar for details or open the full ranking.
Research Hotspots
- Areas:Search OpenAlex research subfields and open the papers or TRSM faculty behind any area.
- Trends:Follow the leading research areas by year; hover a year for its breakdown or a legend item to focus an area.
Publication Leaderboard
- Faculty:Search and sort TRSM faculty by publications, unique co-authors, or TRSM collaborations; select a count to open its details.
- Output:Compare yearly TRSM publication volume over the selected period.
Collaboration Leaderboard
- Pairs:Find frequent co-author pairs with three or more joint papers, then open the publications behind any pair.
- Patterns:Compare new versus repeat collaborations, the internal-external split, and leading external research partners.
How connectivity is measured
A researcher’s Co-Authors count is their degree centrality — the number of unique people they have co-authored. TRSM Collaboration counts only co-authors who are TRSM faculty. Repeat publications with the same person do not increase either count.
Find Collaborators Tool
Find new collaborators for each faculty member, ranked by shared co-authors and overlapping research interests.
Find Collaborators Tool
Find new collaborators for each faculty member, ranked by shared co-authors and overlapping research interests.
The Find Collaboratorstool proposes new collaborators for each faculty member. Every suggestion blends three signals across two dimensions: network proximity, measured by shared co-authors, and topical similarity, measured by both publication similarity and research-topic overlap. All three contribute to one ranked compatibility score between two researchers who aren’t already collaborators.
1 · Network score
Rewards shared co-authors, but gives less weight to highly connected “hub” contacts, so a mutual collaborator with only a few collaborators counts for more than one shared with hundreds.
2 · Research score
Uses an AI model to analyze each researcher’s paper titles and abstracts, then estimates how closely related their research is based on the ideas they write about, not the exact words used.
3 · Topics score (OpenAlex)
Papers are tagged with subject areas curated by OpenAlex. This score measures how much two researchers’ subject tags overlap. This is complementary to the Research Score since two people can work in the same area without OpenAlex tagging their papers the same way, and two papers can share a formal subject tag even when they don’t work in the same domain.
Combining the signals
All three signals are put on the same scale so they can be compared fairly, then combined into one score, weighted by default at 50% network, 30% research, and 20% topics. A pair shows up if they share co-authors, have closely related research, or are a lapsed collaboration, so even researchers with no shared co-authors can still get a recommendation based on their research alone. Each card shows the breakdown and the shared research areas behind a match.
Lapsed collaborationsare pairs who co-authored in the past but haven’t published together in 3+ years. They’re listed separately as ‘reconnection’ opportunities.
Data Sources & Methodology
Where the publication data comes from and how it is cleaned
Data Sources & Methodology
Where the publication data comes from and how it is cleaned
Primary Source: OpenAlex
OpenAlex is a free and open index of the world's scholarly research system. We use their API to automatically harvest peer-reviewed articles, book chapters, and pre-prints authored by TRSM-affiliated researchers.
Supplementary Source: Web of Science
To ensure coverage of publications not indexed in OpenAlex, we integrate a manually curated dataset from the Web of Science citation index, specifically filtered for TRSM affiliated authors.
Data Processing & Quality
- Deduplication: Publications appearing in both sources are automatically merged using DOIs and title/author matching.
- Normalization: Researcher names are normalized to resolve variations (e.g., handling middle initials or name changes).
- Periodic Updates: The underlying data is refreshed weekly to include newly published research and administrative corrections.
Use Cases for TRSM Faculty
A few concrete ways faculty can put the Collaboration Map to work:
Find Your Next Collaborator
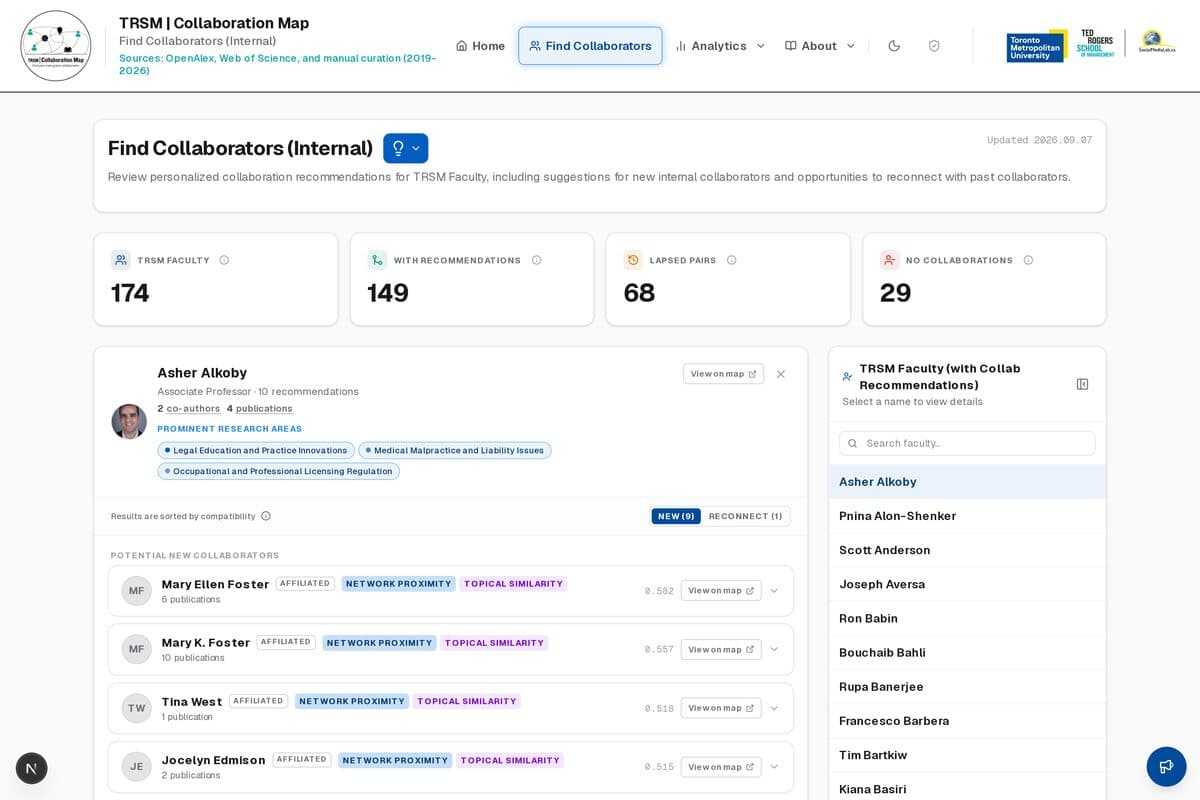
Starting a new grant application, or want to branch into a new research area? The Find Collaborators tool ranks every other TRSM researcher for you personally, combining shared co-authors and overlapping research topics. Pick your name from the list and see who's the strongest fit, and why.
Find Collaborators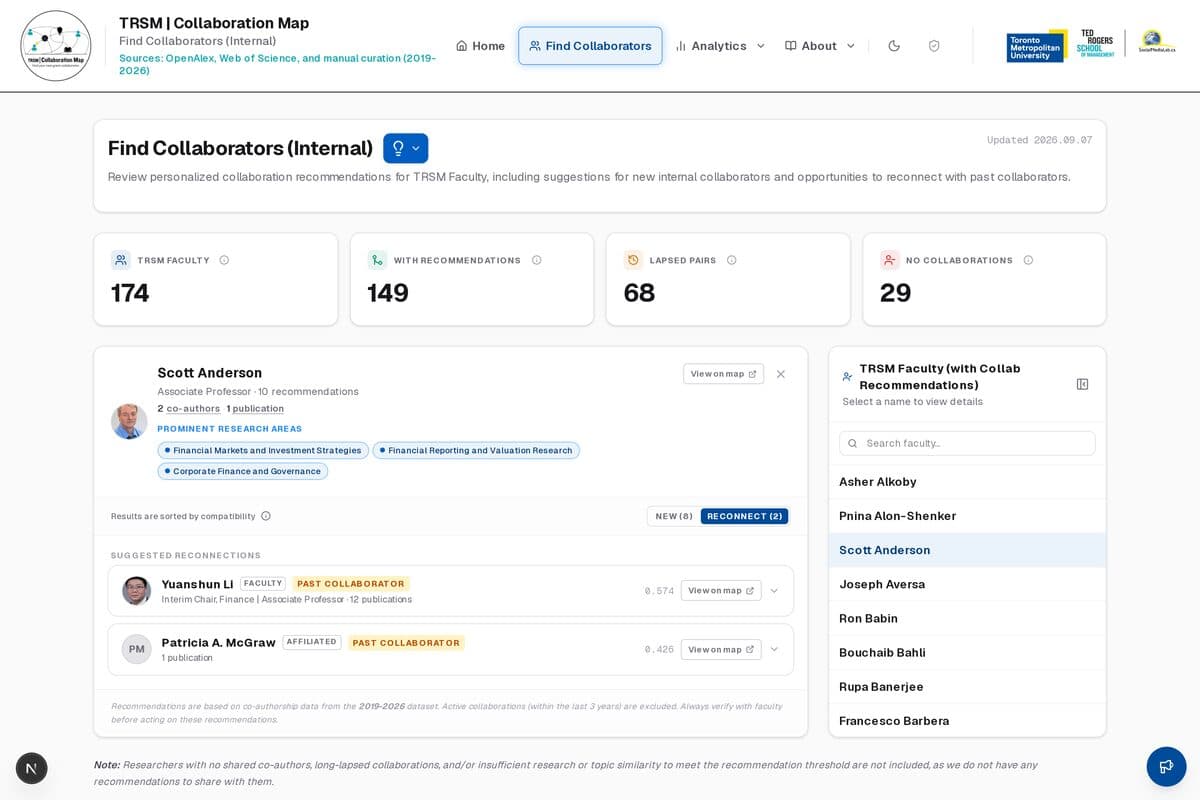
Reconnect With a Past Co-Author
Some of your best partnerships may have quietly gone quiet. The Reconnect tab in the Find Collaborators tool flags past co-authors you haven't published with in three or more years, a low-effort way to revive a collaboration that already worked once.
See Reconnection Ideas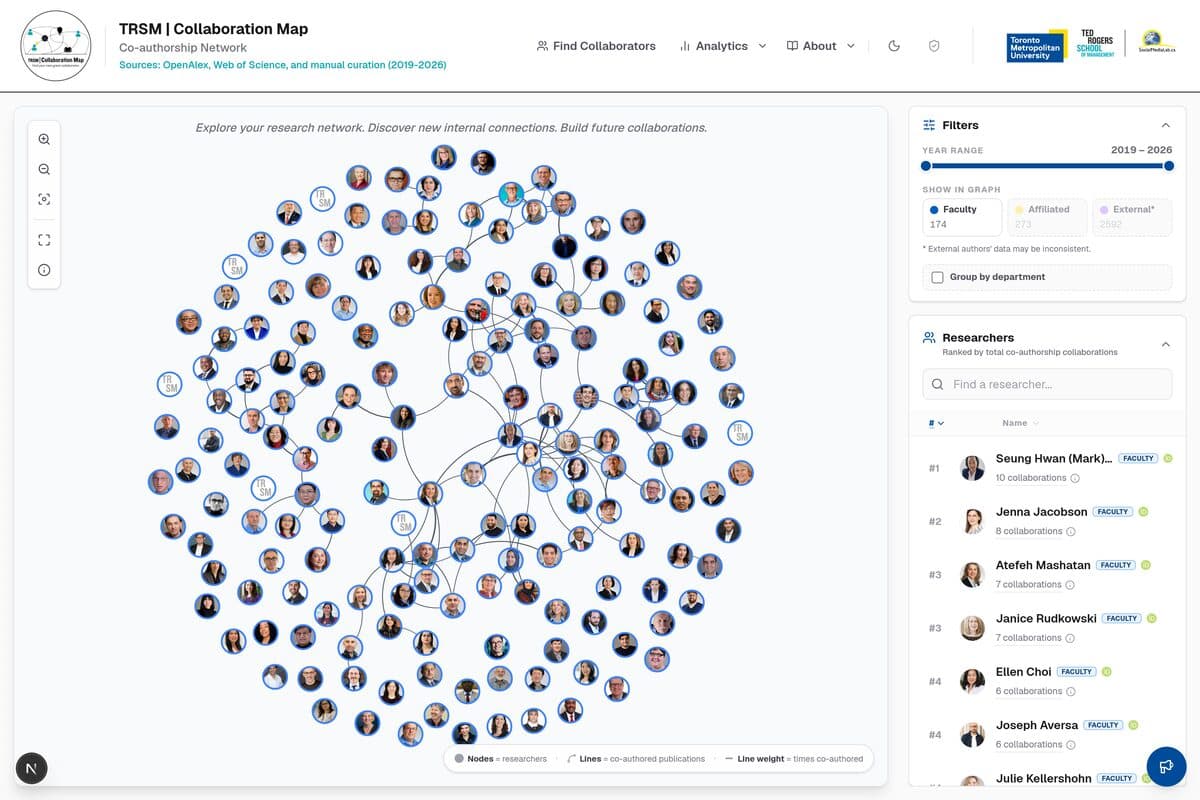
See Your Research Network at a Glance
Every researcher's full co-authorship footprint, mapped in one view. Search your name on the Network Map to see everyone you've published with, positioned by how closely you work together, useful for a bio, an annual report, or just understanding your own reach.
Explore the Network Map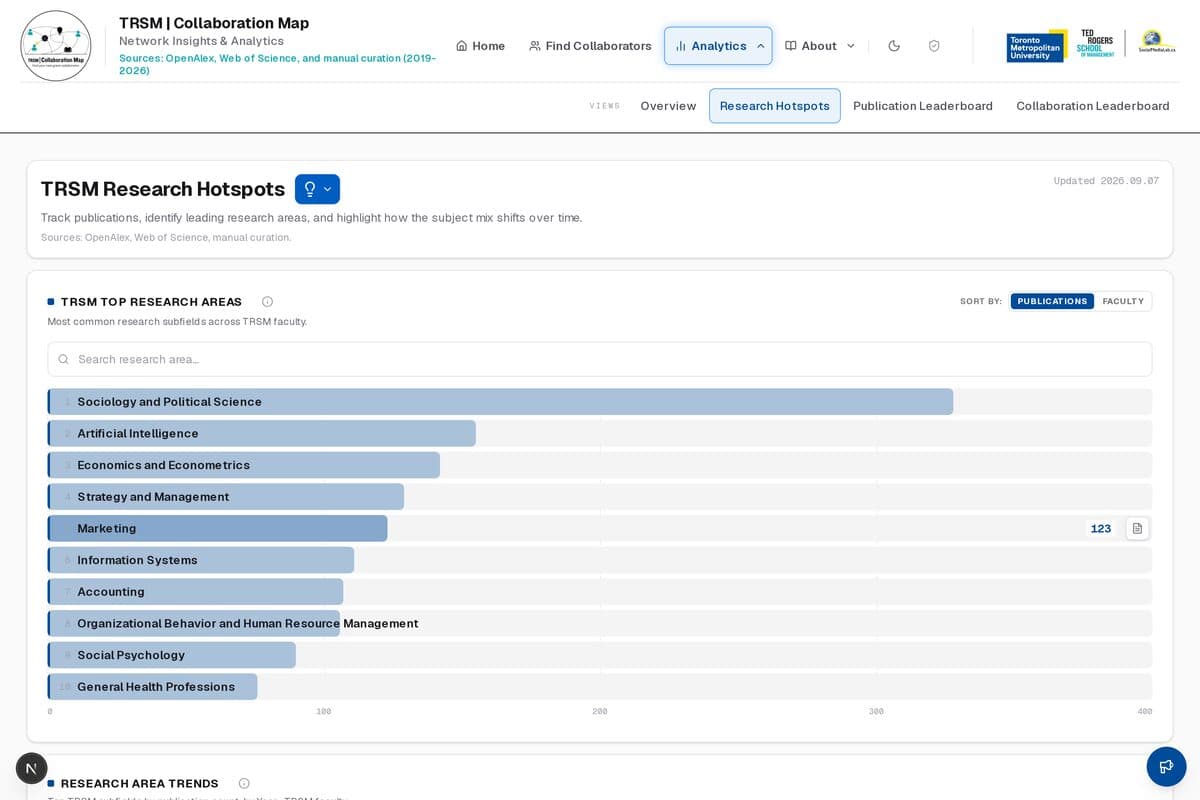
Spot Emerging Research Areas at TRSM
The Research Hotspots view tracks which subfields are growing fastest across the school, year over year. Scan it before a new interdisciplinary initiative or grant call to see where momentum, and potential collaborators, are already building.
View Research Hotspots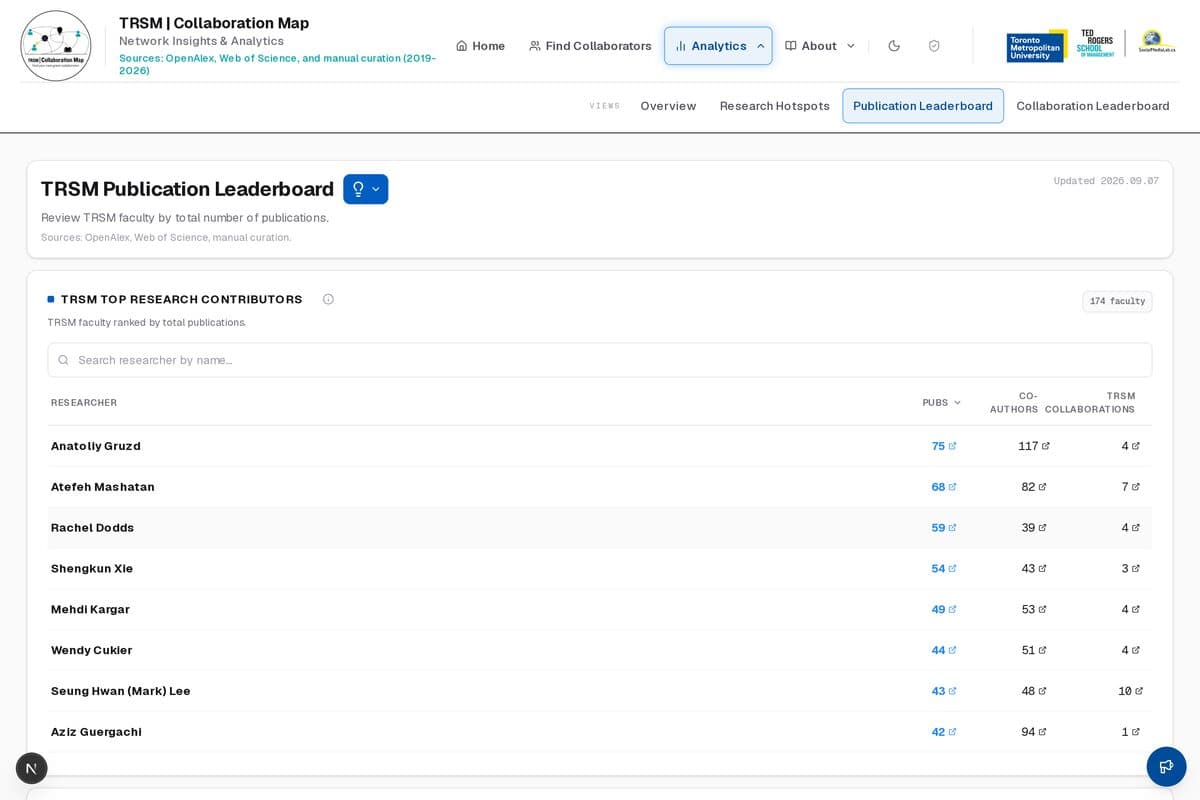
Benchmark Your Publication Output
See how your publication count, co-author network, and TRSM collaborations compare to your department and the school overall, useful context ahead of a performance review or when planning your next few years of output.
View Publication Leaderboard